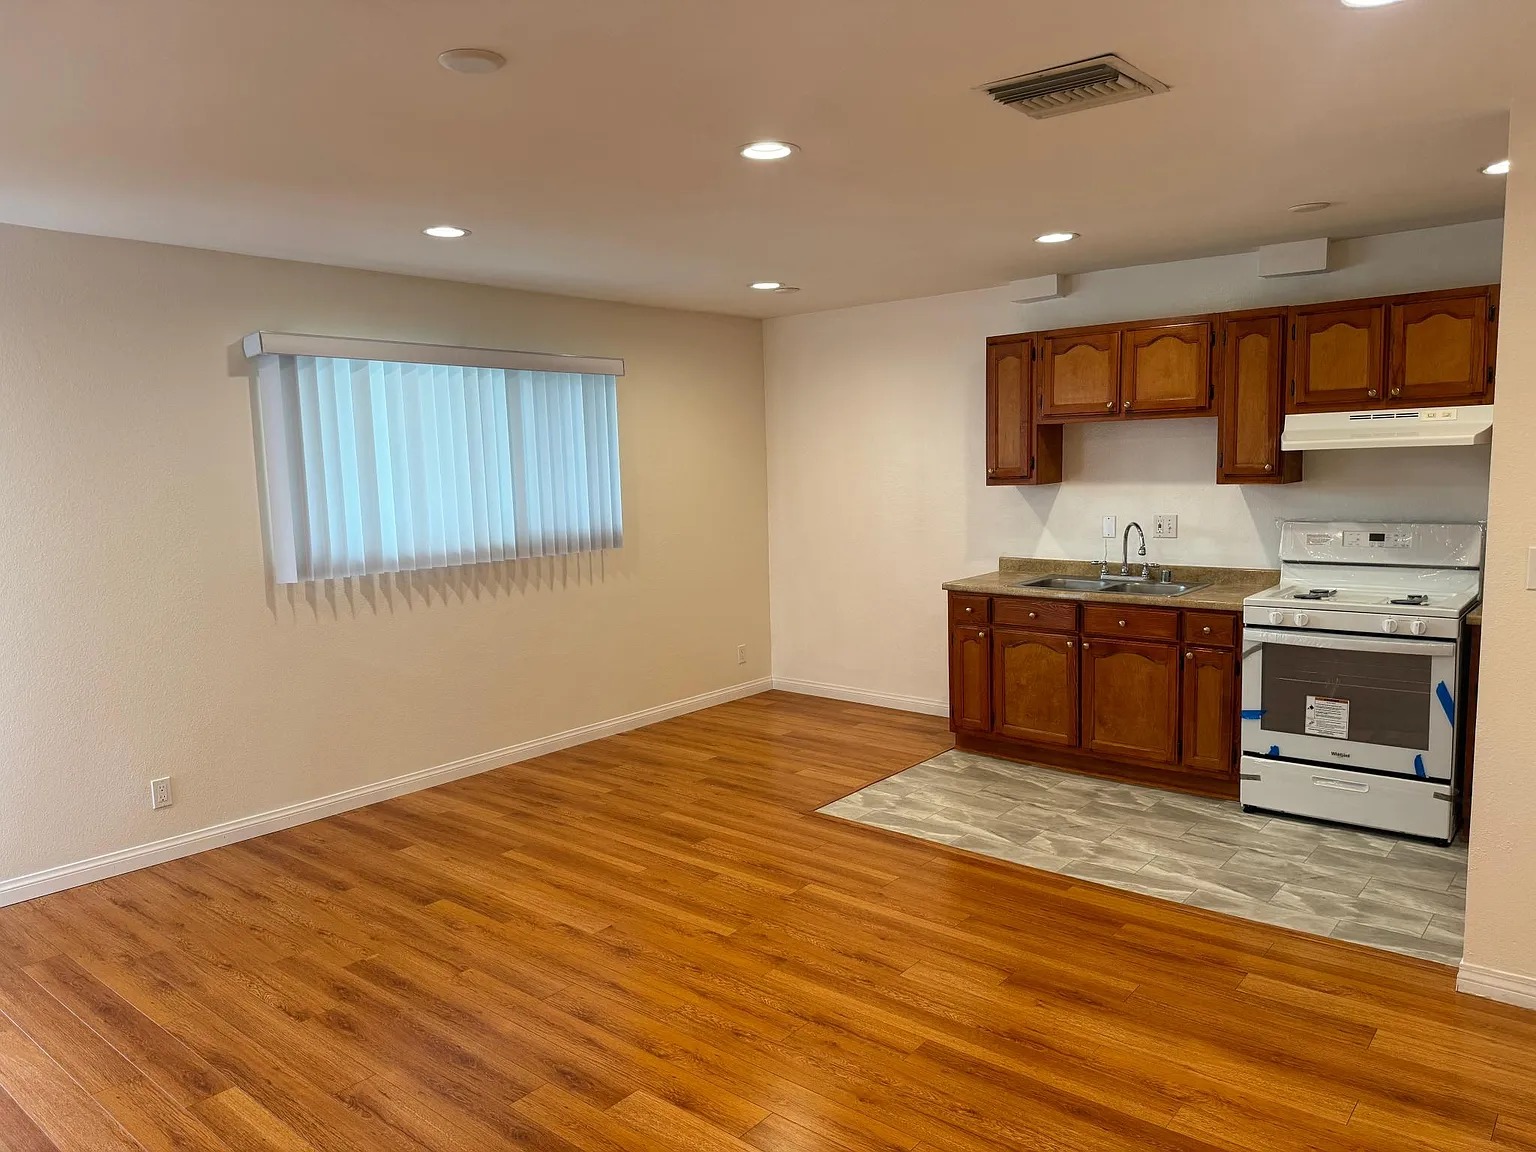
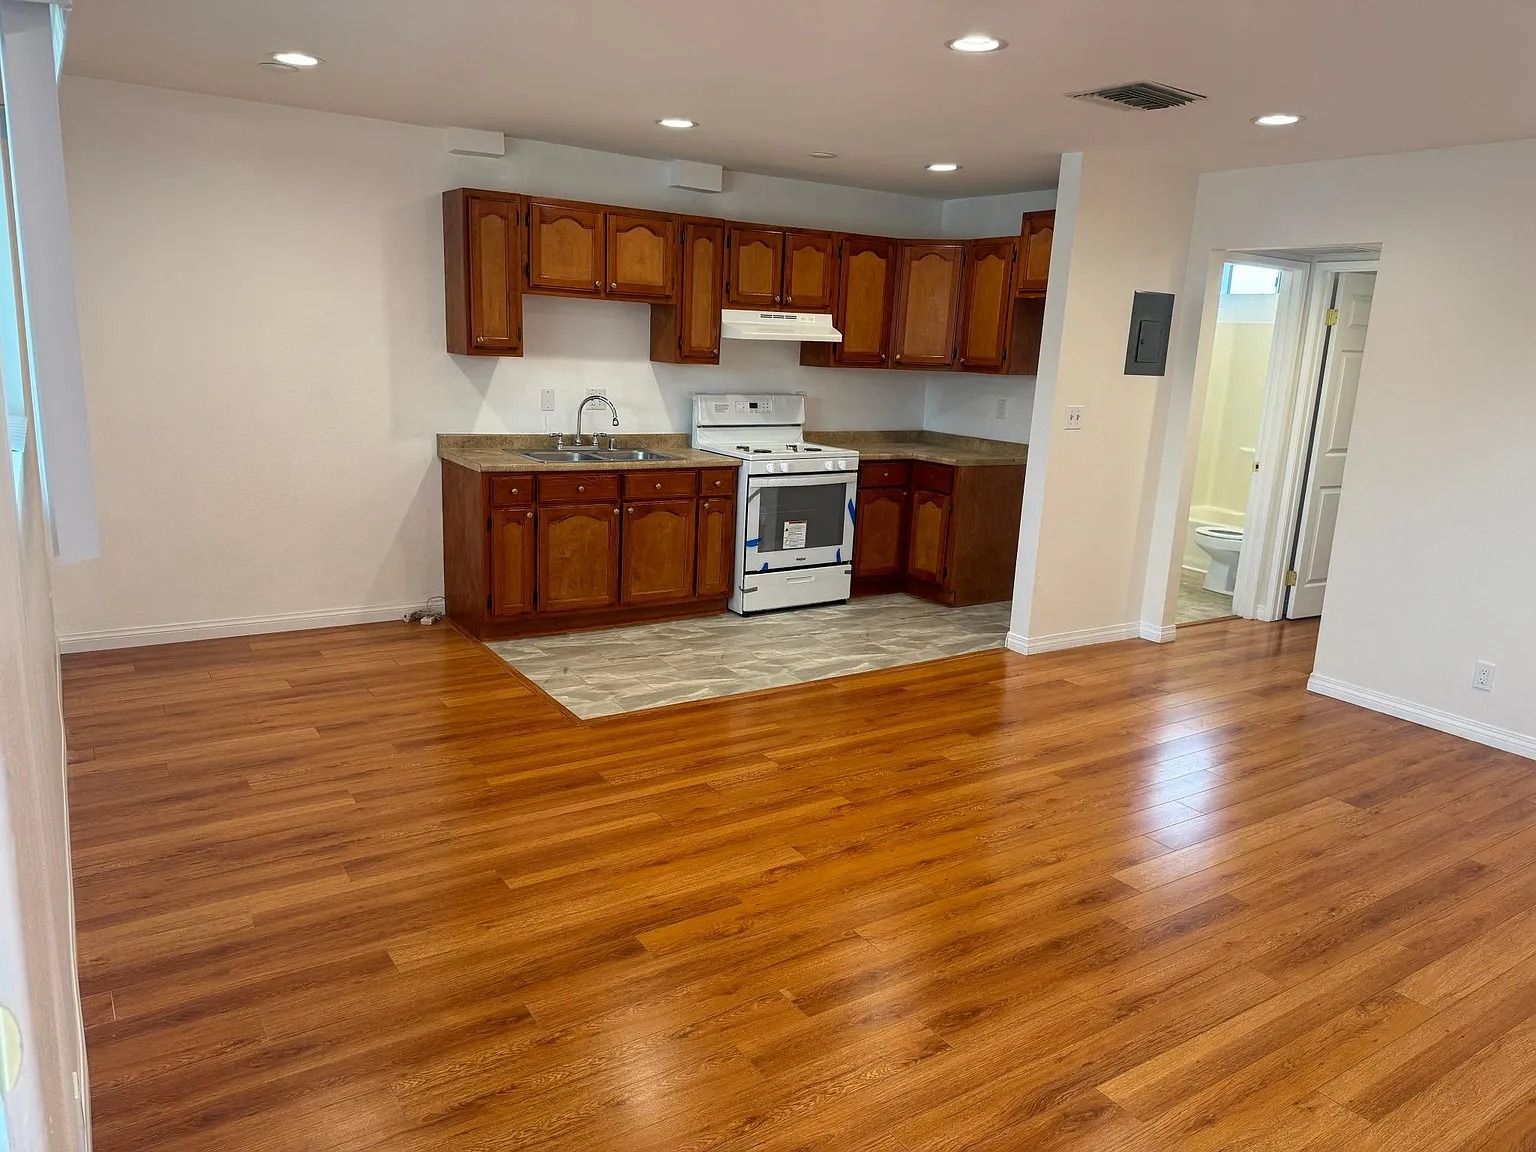
5 of 8 units convey vacant and carry the asking rent in the Current Rent column; occupied units carry their in-place rent.
Notes to the Operating Statement
[1] Additional Income: None. Ownership reports no laundry, parking, storage or utility bill-back income.
[2] Scheduled Gross Income: Eight units at scheduled rent. The three occupied units carry their actual rents of $1,738, $1,795 and $2,400; the five units conveying vacant carry asking rents of $2,000, $2,700 and $3,200, which is standard Los Angeles practice for a property delivering vacant. The market column carries all eight units at underwritten market rents.
[3] Vacancy Reserve: 3.0% of scheduled gross rent. This is an ongoing stabilized reserve and does not model the lease-up period on the five units conveying vacant, which is a one-time cost a buyer should underwrite separately.
[4] Real Estate Taxes: Underwritten at reassessment on the recommended list price of $2,750,000 using the 1.1833% effective rate derived from the subject's own 2025 tax bill, $18,197 against $1,537,790 of assessed value, in tax rate area 2-530, or $32,541 per year. Ownership's current taxes reflect a 2004 purchase basis and will not survive a sale.
[5] Insurance: Carried at the LAAA underwriting allowance of eight units at $200 plus 6,844 gross SF at $1.00 per SF, or $8,444. Ownership's actual 2025 premium is $6,939. Obtain current quotes during diligence.
[6] Utilities - Water, Power & Trash: Ownership's expense schedule as reported, a single combined annual line. The building is master-metered for these services.
[7] Utilities - Gas: Ownership's expense schedule as reported, So Cal Gas annual total.
[8] Repairs & Maintenance: Ownership's reported spend: misc repairs $3,690, plumbing $1,150, materials $1,183 and window covering $57. This is a single year of reported cost, not a trailing twelve-month statement.
[9] Landscaping: Ownership's expense schedule as reported, gardener annual total.
[10] Fire Department Inspection: City of Burbank Fire Department annual inspection fee per ownership's expense schedule.
[11] Replacement Reserves: $250 per unit per year. Ownership's schedule carries no reserve line, so this is an addition to reported cost rather than a restatement of it.
[12] Management Fee (4.0% of EGI): Underwritten at 4.0% of effective gross income. Ownership's schedule carries no management line, so this is an addition to reported cost rather than a restatement of it.
Summary
|
| Price | $2,750,000 |
| Number of Units | 8 |
| Price per Unit | $343,750 |
| Price per SF | $401.81 |
| Current GRM | 12.37 |
| Market GRM | 11.87 |
| Current Cap Rate (LAAA calculation: current NOI / recommended value) | 5.35% |
| Market Cap Rate (LAAA calculation: market NOI / recommended value) | 5.66% |
|
| Structure | All Cash |
| Equity Required | $2,750,000 |
Current scheduled gross rent of $222,396 carries the three occupied units at their actual rents and the five vacant units at asking, which is standard Los Angeles practice for a property conveying vacant. After a 3.0% vacancy reserve and $68,629 of operating expenses, current net operating income is $147,095, a 5.35% return on the recommended price and a 12.37 gross rent multiplier. Real estate taxes are reassessed at the $2,750,000 list price, which is what carries the expense line below the prior underwriting. At market rents across all eight units, scheduled gross rent rises to $231,600 and net operating income to $155,666, a 5.66% return.
Set against the only directly comparable active listing, the recommendation holds up on every metric a buyer will run. 2001-2005 Grismer Ave, a fourteen-unit 1987 building nine tenths of a mile away, asks $5,350,000: $382,143 per unit, $472.03 per SF, a 4.56% cap and a 14.46 gross rent multiplier, 100% occupied. The subject at $2,750,000 is $343,750 per unit and $401.81 per SF, a 5.35% cap and a 12.37 gross rent multiplier. That is 10.0% less per unit and 14.9% less per square foot, eight tenths of a point more going-in yield, a building three years newer, and five of eight units delivering vacant instead of none. The comparison carries a third column at an indicated market value of $4,500,000 for Grismer, where it prices at $321,429 per unit, $397.04 per SF, a 5.42% cap and a 12.16 multiplier. Those two cap rates are not measuring the same thing: Grismer's rests on in-place rent averaging $2,203 against the $2,750 its own offering memorandum carries as market, so a buyer there is still acquiring the rent growth. The subject's rests on income already at market. The four closed sales in the comparable set traded at 3.87% to 5.00% caps and 14.46 to 16.09 gross rent multipliers, and at $375,000 to $587,500 per unit. The subject at a 5.35% cap, a 12.37 multiplier and $343,750 per unit is priced at a wider yield, a lower multiplier and less per unit than any of them.
The recommended $2.75M enters at the floor of the supportable range of $2.75M to $2.98M. Below that floor the property is underpriced against every per-square-foot comparable in the set. The balance of the range is left to competition rather than asked for up front, because a higher entry would lean the stated return on leasing all five vacant units at the top of the asking range without a period of carrying cost.
Recommended List Price
$2,750,000
Supported value range: $2,750,000 to $2,975,000
Disclosures
No trailing twelve-month operating statement exists for this property. Every expense line is either a single reported annual figure from ownership's schedule or an underwriting allowance, and the income statement is built from the rent roll rather than from collections.
Real estate taxes are reassessed at the recommended list price using the 1.1833% effective rate derived from the subject's own 2025 tax bill, $18,197 against $1,537,790 of assessed value, in tax rate area 2-530. Ownership's current taxes reflect a 2004 purchase basis and will not survive a sale.
Insurance is carried at the LAAA underwriting allowance of $8,444, calculated as eight units at $200 plus 6,844 gross SF at $1.00 per SF. Ownership's actual 2025 premium is $6,939. The allowance is used so a buyer is underwritten to a market replacement policy rather than to an incumbent's rate.
A management fee at 4.0% of effective gross income and replacement reserves at $250 per unit per year are added to ownership's reported costs. Ownership's expense schedule carries neither line, so together these represent $10,629 of annual cost a buyer will incur that the seller does not currently report.
Five units carry no rent on ownership's rent roll and enter scheduled income at asking rents of $2,000, $2,700 and $3,200. This accounts for $151,200 of the $222,396 current scheduled gross rent. Stated current cap rate and gross rent multiplier are calculated on that basis.
Per-unit square footage is approximate. The county publishes gross building area only, so the 675, 900 and 1,200 SF unit sizes shown are broker estimates and are labelled as approximations wherever they appear. They total 6,600 SF rentable against 6,844 SF gross. All building-level figures, including price per square foot, use the 6,844 SF gross area, which is why the building-level price per square foot differs from any unit-level calculation.
The City of Burbank has no rent stabilization ordinance. Rent increases are governed by AB 1482 at the lower of 5% plus CPI or 10% through January 1, 2030, and Burbank's Tenant Protection Ordinance, effective August 31, 2024 and amended March 11, 2025, applies just-cause, relocation and anti-harassment rules to covered units. On October 28, 2025 the City Council directed staff to draft a 4% soft cap on rent increases; that ordinance has not been adopted as of this date, and the drafted version would reach buildings with certificates of occupancy before February 2, 1995.
This is a broker's opinion of value prepared for the owner, not an appraisal. It relies on public records, ownership-provided documents and published asking rents, none of which have been independently audited. Comparable income for all four sales is as published by the 2001-2005 Grismer Avenue listing brokerage and has not been independently audited. Nine recorded-transfer-tax sales screened within 1.75 miles were excluded from this analysis as stale and income-free. A buyer should verify unit count, condition, systems, parking configuration, permits and all income and expense figures through inspection and diligence.